Updated for 2023!
We are pleased to present our 2023 report on that age old question – How much do tradies really earn?
For 2023 our research reveals average annual earnings of $90,940 for construction tradies in Australia.
But that’s only a small part of the story… Keep reading to view our top 10 tradie earners for 2023 and more interesting stats.
This is the first time we have updated the report since 2019, and with data coming from over 3,000 self-employed tradies, it’s our biggest ever!
It’s important to note that our report focuses on self-employed tradies in the construction industry.
We believe it is the best representation of how much Aussie tradies are really earning, as it utilises the taxable incomes provided to us by thousands of self-employed tradies from around Australia.
The numbers in this report are based on personal taxable income. It is not revenue, it’s not charge-out rates, it’s not necessarily profit. It’s personal taxable income.
We all know that hourly rates have little meaning when it comes to your taxable income. Just because you charge $150 an hour doesn’t mean you can multiply that by 38 hours and get your weekly earnings!
Every year we get loads of feedback about this report. Some people say the figures are way too low, whilst others say they’re way too high. But hey, that’s what an average is right?
As you’ll read below, our numbers are within 3% of the numbers published by the Australian Bureau of Statistics, so they can’t be too bad!
The Highest Earning Tradies
Whilst our figures cover a very wide number of trades and occupations, we only detail the top 10 trades that we have sufficient numbers for, in order to remain statistically accurate.
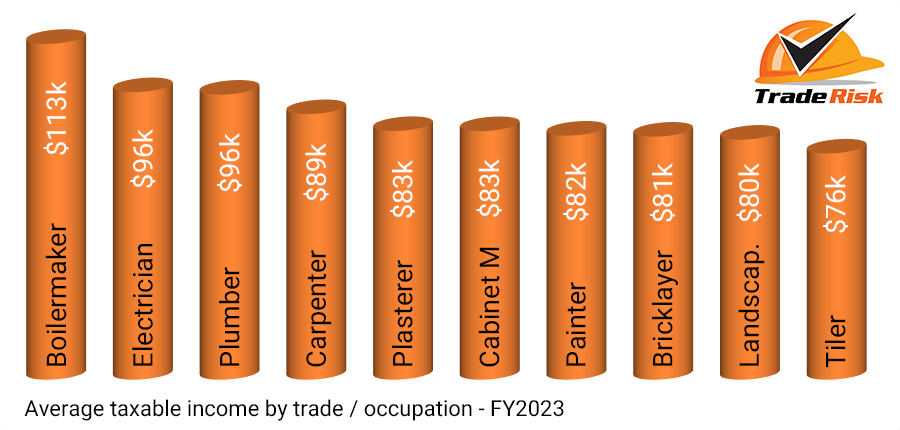
So without further ado, here are the top 10 earning trades for the 2023 financial year:

As with last year the top three on our list were unchanged.
Boilermakers topped the list again with an average income of $112,535. This was up a modest 3.3% on our 2019 report.
In second place were electricians with an average income of $96,338, up 5.3% on 2019.
Plumbers again rounded our the top three with an average income of $95,507. This was an increase of 6.6% on our last report.
Before you say “I know plenty of electricians and plumbers who earn more than $100k”. Yes we know they do, and plenty in our data did too, but these are average figures.
| Rank | Change | Trade | Income | Change |
| 1 | – | Boilermakers | $112,535 | +3.3% |
| 2 | – | Electricians | $96,338 | +5.3% |
| 3 | – | Plumbers | $95,507 | +6.6% |
| 4 | +2 | Carpenter | $88,979 | +14.4% |
| 5 | – | Plasterers | $83,327 | +5.4% |
| 6 | +1 | Cabinetmakers | $83,286 | +12.3% |
| 7 | +1 | Painters | $81,782 | +16.2% |
| 8 | +1 | Bricklayers | $81,437 | +18.7% |
| 9 | +1 | Landscapers | $80,417 | +17.7% |
| 10 | -6 | Tilers | $75,783 | -11.9% |
Bricklayers enjoyed the largest percentage increase, with an 18.7% increase in annual income, but still sitting towards the bottom of the top 10.
There wasn’t a great deal of movement in terms of rankings. Carpenters were the biggest risers, but only by two positions, moving up from 6th to 4th.
Tilers were the only trade to suffer a loss, dropping from 4th to 10th, with an 11.9% reduction in average income at $75,783. Tilers were the only top 10 trade to go backwards.
It’s worth noting that in our previous report, tilers made the opposite move. They jumped from 10th to 4th with a 15.8% increase in income. It could be that their previous jump up the list was an anomaly.
Other Trades
As always there were a number of trades and occupations that could have featured in the top ten, however the number of entries were considered too low to be statistically accurate.
We’ve listed them below, but keep in mind that the number of entries for each are very low, so you shouldn’t put too much weight on them.
- Rigger – $105,000
- Air Conditioning / Refrigeration – $104,153
- Roofing Contractor – $103,457
- Concreter – $99,012
- Flooring Contractor – $96,625
- Fencing Contractor – $90,389
- Scaffolder – $87,500
- Arborist – $86,846
There are a number of others who’s numbers were even smaller and not even worth publishing, but with more entries definitely could have cracked the top ten.
These include form workers, solar installers, earthmovers, tree loppers and more.
If you’re in one of these trades and want to see yours in the top ten, use Trade Risk for your personal accident insurance to help us gather more figures! You’ll be rewarded with award-winning service and advice.
Non-Trades
There are two occupations that could have been included in our list, but they’re not trades as such, so we’ve chosen not to.
But if you’re interested, handymen had an average income of $75,657. This wouldn’t have been enough to crack the top ten, but it wasn’t that far off.
Builders came in at $98,879, but we shouldn’t read too much into that number. Some “builders” are genuine builders, whilst others might be carpenters running smaller projects but still calling themselves builders.
Comparison to the National Average
Our figures show that the average taxable income for a tradie in 2023 is $90,940. This is the first time that the average has cracked $90k, and represents an 11% increase on our 2019 numbers.
The national full time average income in Australia, according to the Australian Bureau of Statistics, is $99,221. For workers in the construction industry the ABS reports an average of $93,704.
That puts our numbers within 3% of the ABS numbers, which gives us a lot of confidence that our figures are very representative of the true earnings of Aussie tradies.
It’s important to remember that our figures include tradies who are predominantly sole traders and subcontractors, whereas the national average from the ABS will include all sorts of outrageously paid CEOs and executives.
For that reason, just because the tradie average is below the national average, it does not mean that a typical tradie earns less than a typical non-tradie.
Average tradie earnings by state
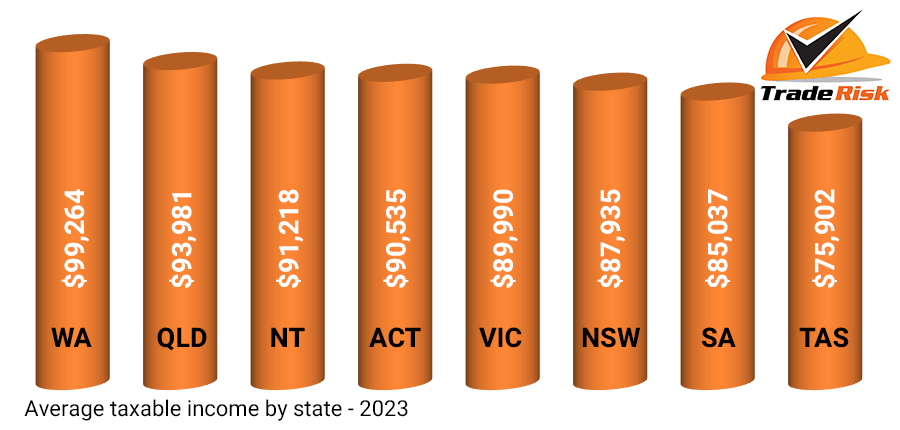
For 2023 we’ve added something new to the report, which is the average tradie income for each Australian state.
The two territories – ACT and NT – should be viewed with an asterisk next to them. They had good data, but a little lower than what we would have liked to be statistically reliable.

| Rank | Change | State | Income | Change |
| 1 | +3 | WA | $99,264 | +17.6% |
| 2 | +1 | QLD | $93,981 | +11.0% |
| 3 | -2 | NT | $91,218 | -21.0% |
| 4 | +3 | ACT | $90,535 | +15.8% |
| 5 | +1 | VIC | $89,990 | +14.9% |
| 6 | -2 | NSW | $87,935 | +11.2% |
| 7 | +1 | SA | $85,037 | +11.5% |
| 8 | -6 | TAS | $75,902 | -13.1% |
The spread across the states was very even, with the resource states of WA, QLD and NT taking out the top three positions.
Most states saw a solid increase in the average tradie income, aside from the NT and TAS. NT had a lower number of entries than we would have liked, and TAS was unusually high in our previous report, which makes the decline look worse than it probably is.
Overall income bands
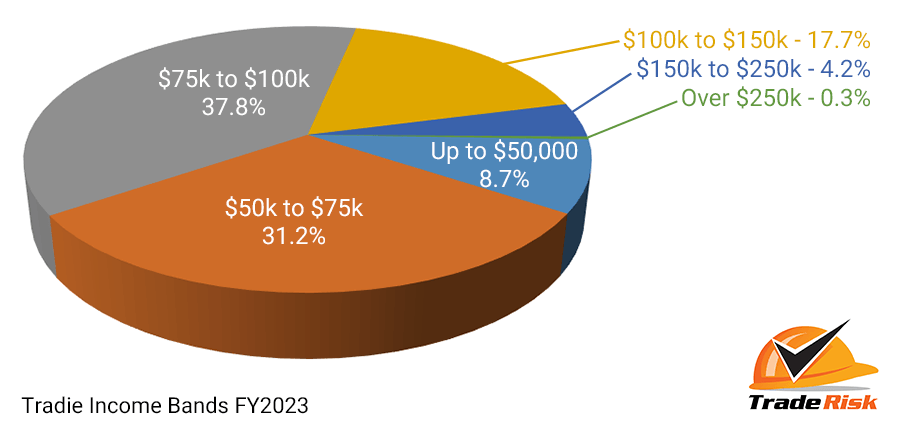
An interesting metric to look at each year is what percentage of tradies fit into the different income bands.

The big change for 2023 is the large numbers of tradies who have moved up into higher income bands.
In the up to $50k range, the percentage dropped from 12.8% to 8.7%. This is good news, meaning less tradies were in the lowest income band.
The $50k-$75k range also shrunk, going from 38.1% to 31.2%. This band had always been the largest each year, but not in 2023.
$75k-$100k is the first band to experience some growth, but only by a tiny margin from from 37.1% to 37.8%.
Overall, the share of tradies earning up to $100k shrunk from 88% in 2019 to 78% in 2023. That’s a positive, with many more tradies now earning six-figures.
The highest growth was in the highest income bands, with the $100k-$150k range growing from 9.6% to 17.7%.
The $150k-$250k range doubled from 2.0% to 4.2%, and the $250k+ range was unchanged at 0.3%.
The largest growth across the board was for tradies moving up into six-figures. Whilst the average income remains under $100k, there are still many earning comfortably over this.
Observations
Each year there are various figures which grab our attention. Here we’ll look at some trends across the last four years of our reports.
Stability at the top
For the fourth year running we’ve had the same top three earning trades.
Of the trades which did move on the ladder, most only moved one or two positions, with tilers being the exception.
Wage growth at the lower end
Whilst the top three earning trades maintained their rankings, there wasn’t huge growth in their averages.
Boilermakers, electricians and plumbers only saw single digit growth in their average wages.
With the exception of plasterers and tilers, all other trades in our top ten saw double digit growth in average wages.
Conclusion
If you want to earn more than the national average, each of the top three trades will get you very close.
Although most trades in the top ten have average incomes lower than the national average, it’s important to point out that plenty of those tradies are still doing very well for themselves.
For example although carpenters have an average income lower than the national average, our figures included plenty of chippies with incomes well over $100k.
By the same token, the figures also included dozens of electricians and plumbers with income below the national average.
The takeaway here is that although some trades do have higher incomes on average, any tradie can earn a great income if they work hard enough and smart enough.
Want to see the previous reports? Follow the links to our 2019, 2018, 2017, 2016 and 2014 reports.
Important information about the figures
When looking at these figures it’s important to get some background on where they’ve come from.
The typical tradesman client of Trade Risk is a subcontractor or sole trader, often working on their own or with just a few staff.
Whilst we do have clients running large teams and earning very strong six figure incomes, they are very much outweighed by the smaller ones.
We also have clients who are semi-retired or just running their business on the side. To account for this we remove all figures where the declared income is less than $45,000. We’re assuming that anyone with an income below this figure is not running their business in a full-time capacity and shouldn’t be included in our figures.
It’s also important to note that the figures are based on personal income declared for personal accident insurance / income protection. So the figures are based on profit, not turnover.
Some tradies may say they ‘earn’ $100k, but if their business expenses are $25k a year then the figure we take is $75k.
We don’t claim that our figures are 100% accurate and reflect every tradesman across every industry.
But what we can say is that the figures have come from over 3,000 tradies from all states and territories, and based on previous years they are incredibly consistent and reliable across the years.
If you have any feedback on our report, please get in touch.
Author: Shane Moore. Last updated: 27/09/2023.
What to read next…
Starting an Electrical Business
Switching from Sole Trader to Company
What Insurance does a Contractor Need


